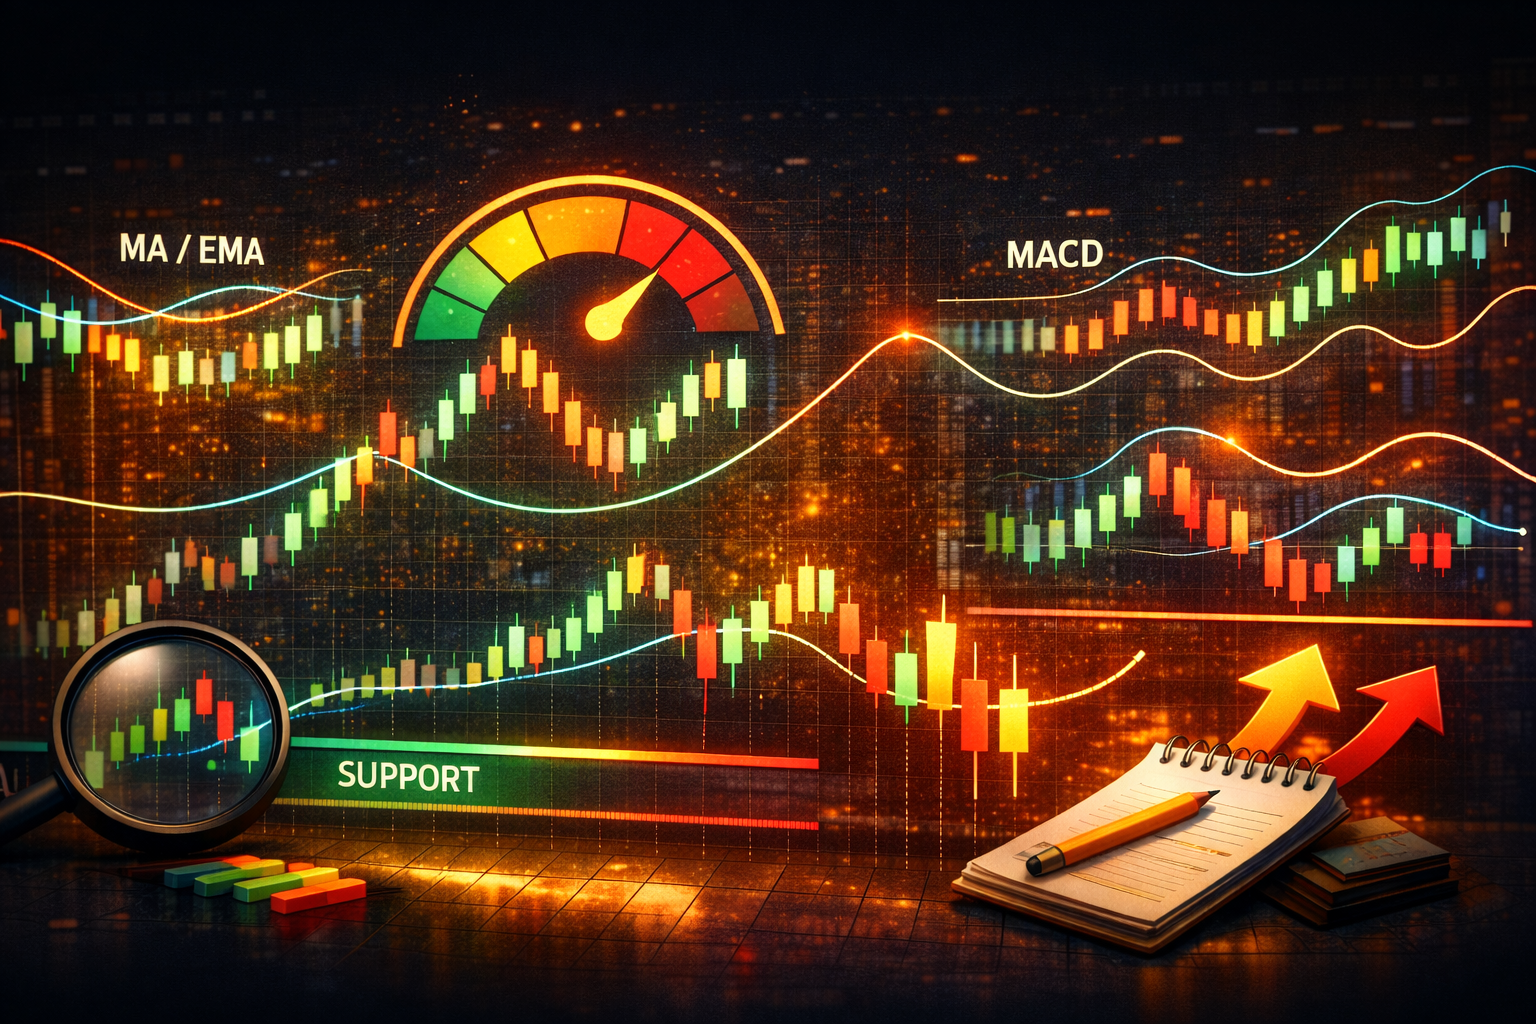
If you’re new to crypto trading, charts and indicators can feel like trying to read a foreign language. Lines, curves, acronyms, arrows, and boxes everywhere — RSI, MACD, MA, EMA, Bollinger Bands — what does any of it mean? Don’t worry. This guide explains the most common technical indicators in plain English. No advanced math. No confusing jargon. Just clarity.
What Are Technical Indicators?
Technical indicators are tools traders use to help understand what might happen next in the market. They analyze past price data to estimate things like trend direction, momentum, and potential buy or sell opportunities. They are not magic, they don’t guarantee anything, and even the best traders still get things wrong — but indicators can help make decisions based on information instead of guessing.
Moving Averages (MA & EMA)
A Moving Average shows the “average price” of an asset over a certain time period. Instead of looking at every single price tick, it smooths everything into a line so you can see the bigger trend.
Simple Moving Average (SMA): The basic average of past prices over a chosen period
Exponential Moving Average (EMA): Similar to SMA but gives more importance to recent prices, so it reacts faster
How traders use them:
• If price stays above the moving average, the trend might be going up
• If price stays below it, the trend might be going down
• When two moving averages cross (like a short-term one crossing a long-term one), it can hint that momentum is shifting direction
Imagine trying to tell if a boat is drifting north or south in choppy water; the waves hide the movement. Moving averages help you see the drift, not the waves.
RSI (Relative Strength Index)
RSI measures whether the market is moving too fast in one direction. It’s like a “speed limit” indicator for price movement.
RSI is on a scale from 0 to 100:
• Above 70 = “overbought” (price may have gone up too fast and could slow down or drop)
• Below 30 = “oversold” (price may have dropped too fast and could bounce up)
It does not predict the exact moment a reversal will happen, but it gives a sense of whether buyers or sellers have been too aggressive.
MACD (Moving Average Convergence Divergence)
MACD measures momentum, which means the strength behind a price move. It looks at the difference between two moving averages and plots it as a line or histogram.
What traders look for:
• When MACD crosses above the signal line, momentum may be turning bullish (up)
• When MACD crosses below the signal line, momentum may be turning bearish (down)
• Bigger histogram bars = growing strength, smaller bars = weakening strength
Think of MACD like listening to the engine of a car. You can’t see the engine, but you can hear when it’s revving higher or starting to sputter.
Bollinger Bands
Bollinger Bands show a price channel — like an expandable tunnel that price moves inside. The bands widen when the market is volatile and shrink when it’s calm.
What traders look for:
• Price touching the top band = price may be pushing high or overheating
• Price touching the bottom band = price may be dropping or undervalued
• When bands tighten (squeeze), a big move could be coming soon
They help traders visualize price pressure, like a balloon inflating or deflating.
Support and Resistance Levels
These aren’t indicators in the same sense as the others, but they are essential. Support is a price level where buyers have stepped in before (price tends to stop falling here). Resistance is a price level where sellers have stepped in before (price tends to stop rising here).
If price breaks above resistance, that resistance can become new support, and vice-versa. It’s like stairs: once you climb to the next step, the previous one now supports you from below.
Putting It All Together (Without Overwhelming Yourself)
You don’t need to master every indicator right away. Most traders start with just a couple and build from there.
A common example beginner combo:
• A Moving Average to help understand the trend
• RSI to judge momentum and whether price is stretched too far
• Support/Resistance to find logical price zones for decisions
From there, you can experiment with MACD and Bollinger Bands once you’re comfortable.
Final Thoughts
Indicators are tools — not fortune tellers. They work best when combined with discipline, risk management, and personal testing. Every trader develops their own style, and what works for one person may not work for someone else.
If you’re just starting out, treat this phase like learning the alphabet of trading. These indicators are the letters. Once you understand them, you can start forming words, sentences, and your own trading language.